Google Analytics User list report (User explorer) | Weboptim
Aggregated analysis of data is very important and worth doing, but sometimes you want to dig deeper, at an individual level. The Google Analytics User List report allows us to do just that.
If we do both aggregate and individual user level analysis, we can understand what is going on. And what needs to be done to improve the user experience and optimise the business.
What is a Client ID?
It is important to understand the meaning of the client ID before you start analysing the User List.
In order for Google Analytics to determine whether multiple sessions belong to the same user, each user must be assigned a unique identifier. This unique identifier is the Client ID. By default, this value is included in the cookie with an expiry date of two years. The value identifies the browser anonymously.
A GA Debugger is one of the tools to determine the Client ID.
- Install the GA Debugger
- Click on the extension
- Visit the specific page where the GA code is
- CTRL + Shift + I
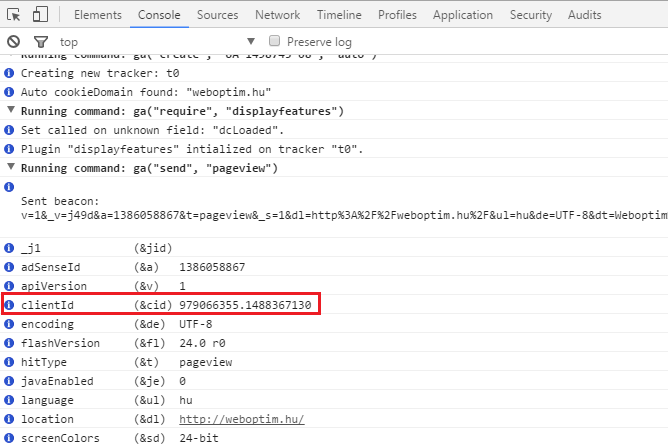
The customer ID consists of 2 parts:
- the first part is a unique random number
- and the second is the first timestamp
All subsequent sessions for the same user will give the same client ID. Keep in mind that this will only work if:
- if the user has not deleted or blocked cookies in the meantime
- if the user does not change browser
- if the user does not change the type of device (laptop, tablet, mobile)
We may consider implementing user ID-if it is a website with many users logging in. This can help us to recognise that it is the same user even if the visitor changes browsers or accesses the site from another device.
Client identifiers in the User List report
The client ID is a key element in the User List report. We click on the Audience / User list menu item. You will see the following:
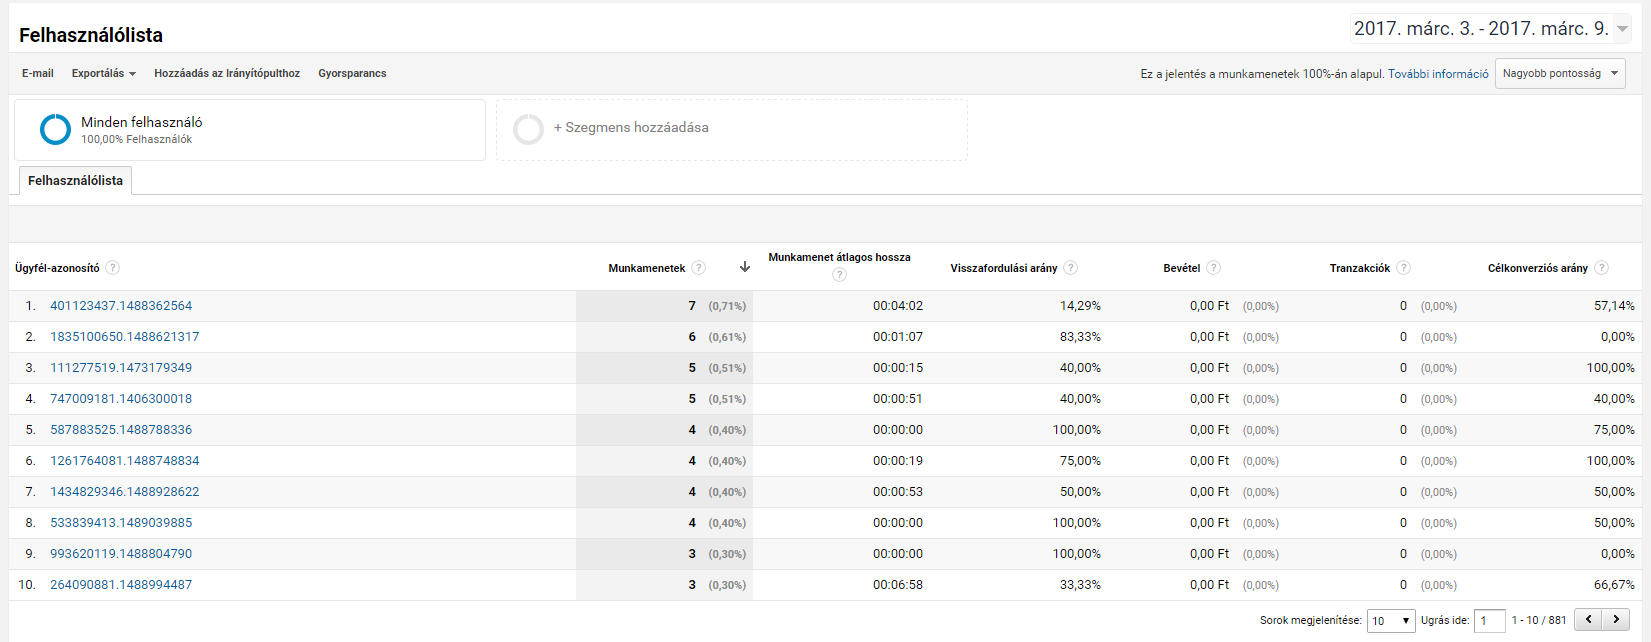
By default, the van:
- one dimension (customer identifier)
- 6 indicators (session, average session length, return rate, revenue, transactions, target conversion rate)
The target conversion ratio is the sum of the individual conversion ratios of the targets that you have set in the current view. This number doesn't mean much if you have set goals such as x page views, y page time. These tend to increase the overall conversion rate. It is recommended that you do not create engagement goals when working with the user list report.
User ID instead of Client ID
If we have built User ID tracking into the website, the report will contain User ID data. The structure of the report doesn't change much, you will just see a different group of users. The users that we have identified using User ID.
Keep in mind that the User ID report is a much more accurate reflection of the real users, as we can track them across multiple devices and browsers.
How do we examine individual users?
Click on the customer ID to learn more about the behaviour of that user during the selected period.
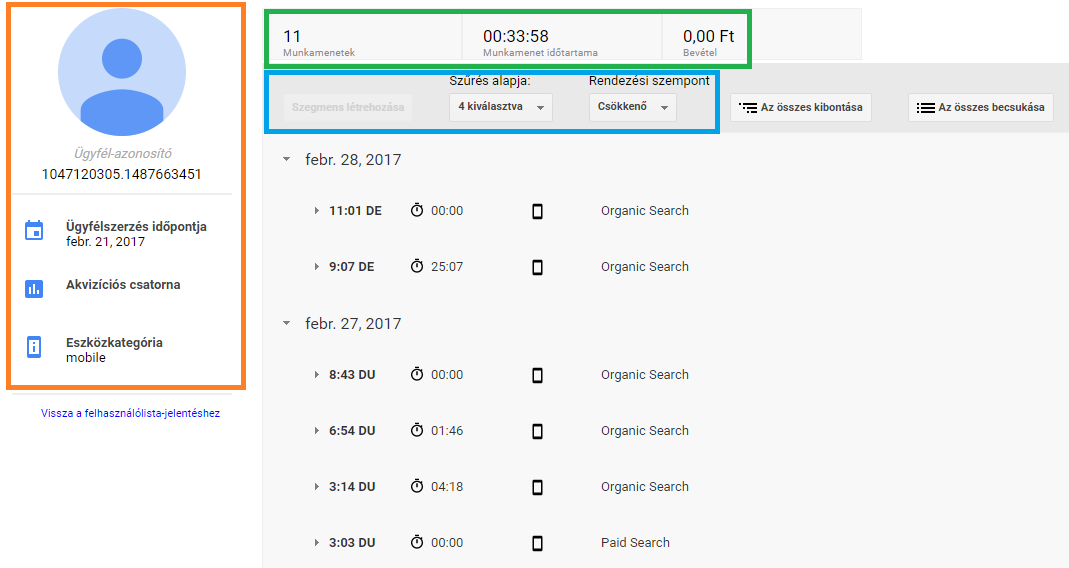
On the left you can see the main information:
- customer ID
- date of customer acquisition
- acquisition channel
- device category
Above are some more details:
- all sessions
- cumulative duration of sessions
- total revenue (for e-commerce)
We also have several filtering and segmentation options:
- sorting (increasing or decreasing)
- filtering: by page views, destination, e-commerce or event
- you can also create a segment directly based on user behaviour
Further comments
- The "original" date of recording will be shown in the overview report. This means that it does not matter whether or not the date of the visit falls within the period we have selected. The first date will always be shown.
- Filter out one or 2 dimensions at a time and do not try to analyse all events, targets and side views at the same time.
- Do not tick the event option in the filtering field if it is implemented many times. This will only distort the data.
- This is a great feature that can be set directly on segments. It's less useful for events, because you can only work with event categories or actions.
- Be careful with segmentation. Before doing so, save all views and accounts associated with your email address.
3 uses
1. Analysis of specific user segments
Segmentation is one of the most powerful GA functions. For example, you might learn that mobile visitors who enter a site through a high-traffic landing page don't convert well.
You can set up a segment that captures these visitors and starts to analyse some of their individual sessions in more depth.
Would visitors turn around immediately upon arrival, back up, or would they have to scroll down too long to see the call-to-action button?
Do visitors return more often or do they only have 1-2 sessions on average?
Be sure to define the segments in advance (and don't waste time clicking on Client ID values). Using user-level segmentation is preferable to using session-level segments.
2. Analysis of customers
You may want to analyse the path of users who make a purchase or complete a conversion on your website.
We get a clear feedback on the conversion path of your customers and this can help you to better structure your content and other marketing activities. Don't expect to find a single solution that you can implement directly, it's not that simple. However, we can certainly learn about potentially more effective customer journeys that can be used later in the conversion optimisation plan.
Focus on what users are saying instead of trying to tell them what they should do. There are a lot of signals in the data that can help further optimise user experience and conversions. Don't make the mistake of simply deploying the change. Be sure to test it first!
3. Increase marketing efforts
This is particularly useful if you have an e-commerce website. It doesn't matter whether you offer just a few services or thousands of products. There is probably a "add to cart" button on the site.
The basket button is a very important indicator. Usually, when the cart abandonment rate increases, the number of conversions will also be higher. However, the percentage of people who leave the cart without buying has skyrocketed in recent years.
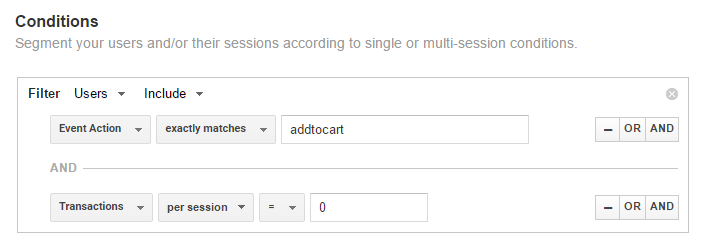
We remarket to users who added to the cart but did not end up buying. Scenario:
- set up event tracking
- event action: addtocart
- e-commerce measurement set
A segment adjustment for those who started the process but did not end up buying:
What we can do:
- create a segment and link the data to a remarketing campaign and target everyone who added a product to their shopping cart but did not end up buying it
- conduct a short, concise individual-level (user list) survey to get more background information on the segment. Based on the results:
- different segments need different remarketing campaigns (based on the product category or a specific product)
- a segment and remarketing campaign covering all products.
There are many other ways to deal with this situation. The point to keep in mind is that the User List report can be an excellent supplement to the aggregated GA reports. Get creative and combine it with your specific business goals to get the most out of this user-level report.
Conclusion
- The User List report is a good addition to the other reports
- This report is definitely not the first report worth looking at. Think about segmentation, specifically which user groups you want to investigate and target first.
- Let's start with an aggregated data analysis before moving on to more detailed, user-level analysis.
- This report is not for those just entering the field of digital analytics. You need to have some experience to really understand how to gain deeper insights with the User List report.
- The reporting functions are still rather limited at this stage. You cannot create a set of your own custom reports based on the client ID.
- Export data to combine online and offline data, or test specific customer identifiers to personalise the user experience.
- There are dozens of ways to make the report useful to us. Think about your website goals and the report can help you get better results and an aggregated approach to optimisation.
Source: online-metrics.com