Moving charts in Google Analytics | Weboptim
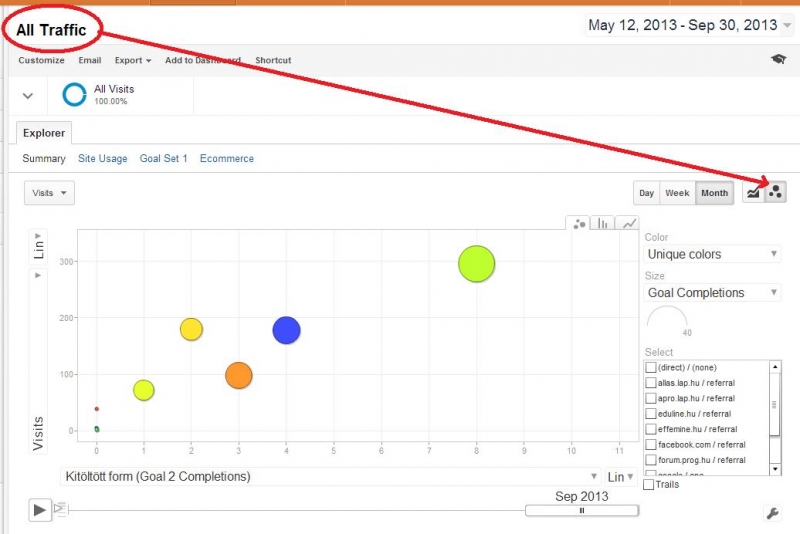
Not everyone may know this, but Analytics can also display moving graphs.
This is a good way to show the client how much progress the project has made. Or, as a website owner, you can monitor the progress of your website.
A few months ago, we started presenting the results of our project in Analytics.
Almost all data can be set on the X and Y axis, and a range of colours and sizes can be applied.
Try it on your own website if you like -> Google Analytics
If you like the article 😉
