10 Adwords reports everyone should know | Weboptim
PPC data is often overlooked when analysing data.
From Adwords Report Editor but it has made data visualisation easier than ever before. In addition to basic reports, it also gives you the ability to create custom graphs and charts, which can be very useful for PPC analysts.
Below are the 10 most useful graphics from it.
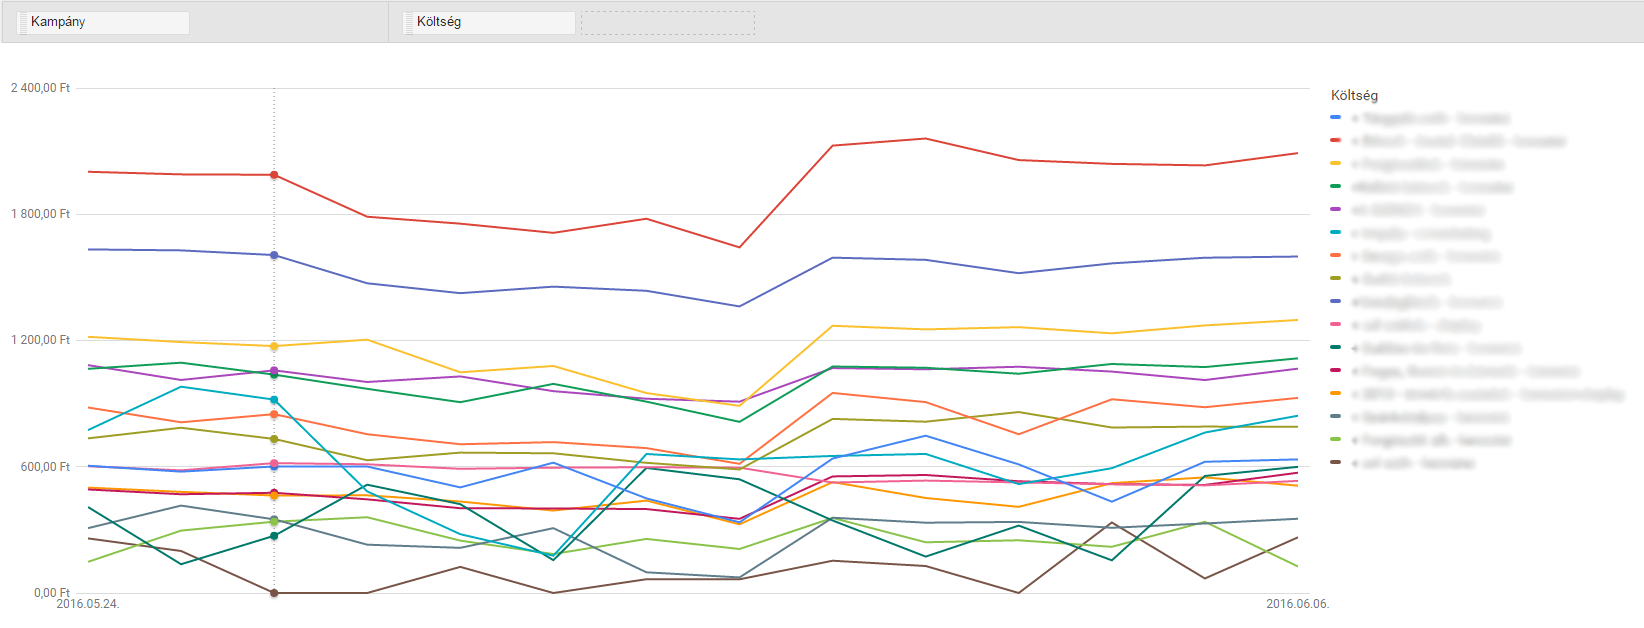
1. Campaign performance over time
Often we see account performance fluctuate, at the level of campaigns, ad groups or keywords. With this report, we can plot each campaign on a trending graph, so we can quickly determine which ones are performing poorly.
Once we have identified the weaker campaigns, we can dig deeper with a similar report (at ad group or keyword level). Be sure to use this report to monitor campaign changes.
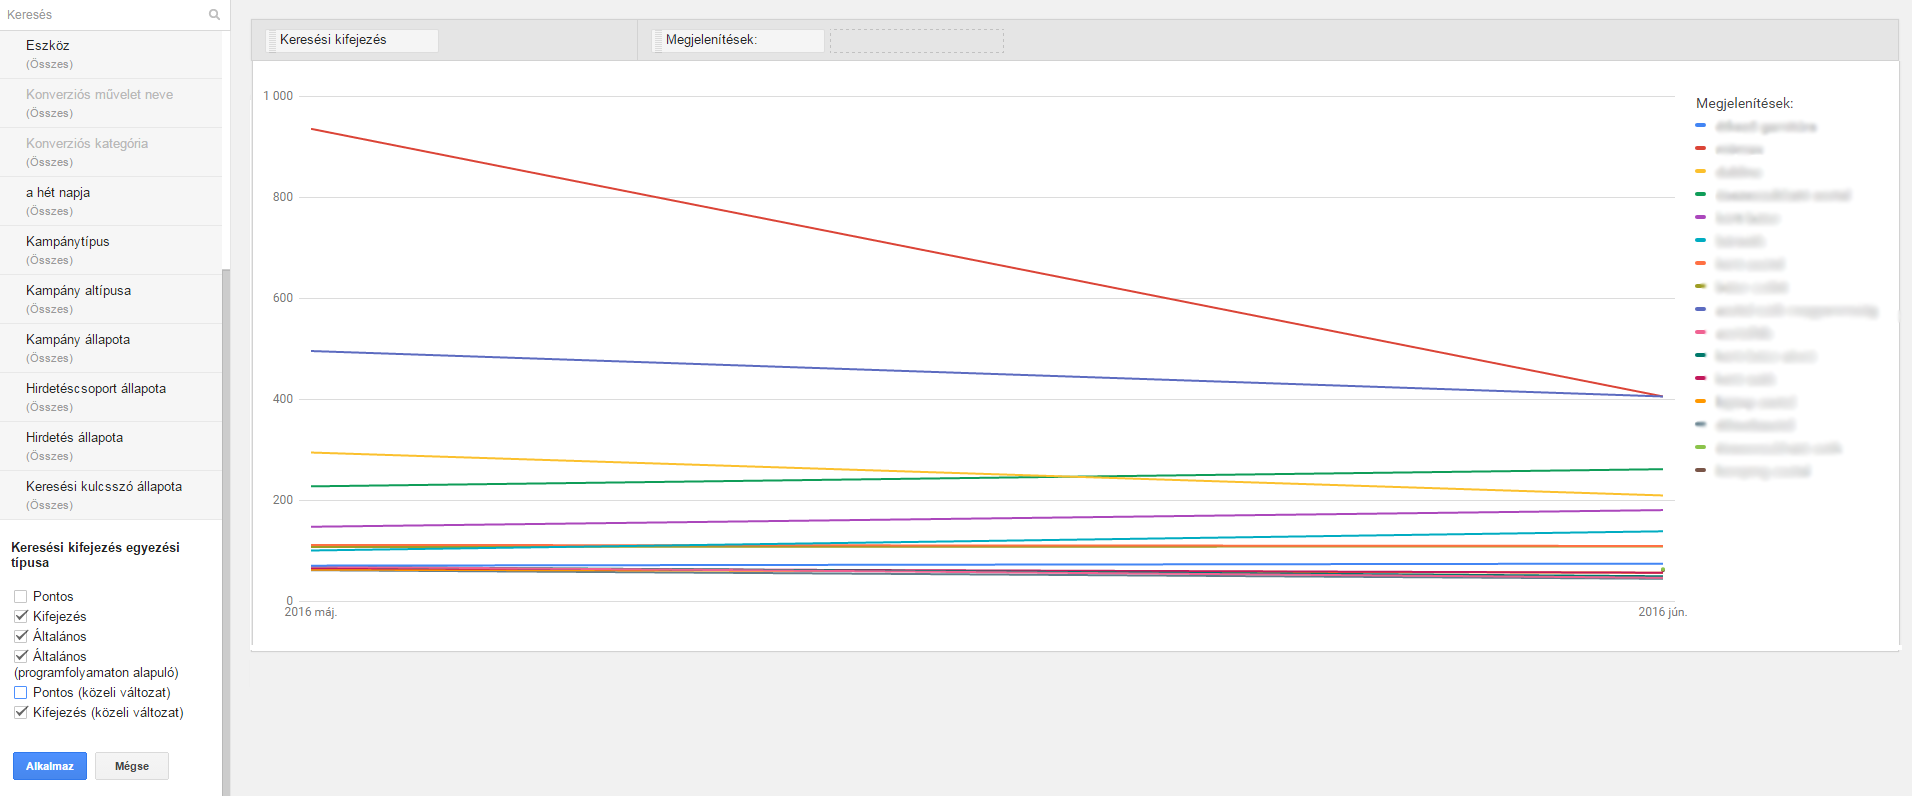
2. Search terms over time - account level
The overlap between search terms and common matching keywords can cause a lot of confusion. This report goes back to basics, regardless of the keyword structure or match type. It aggregates search queries across different ad groups and shows a trend for the most popular queries.
It's a great way to keep track of the most important search terms, while also giving you new ideas for ad copy and keywords.
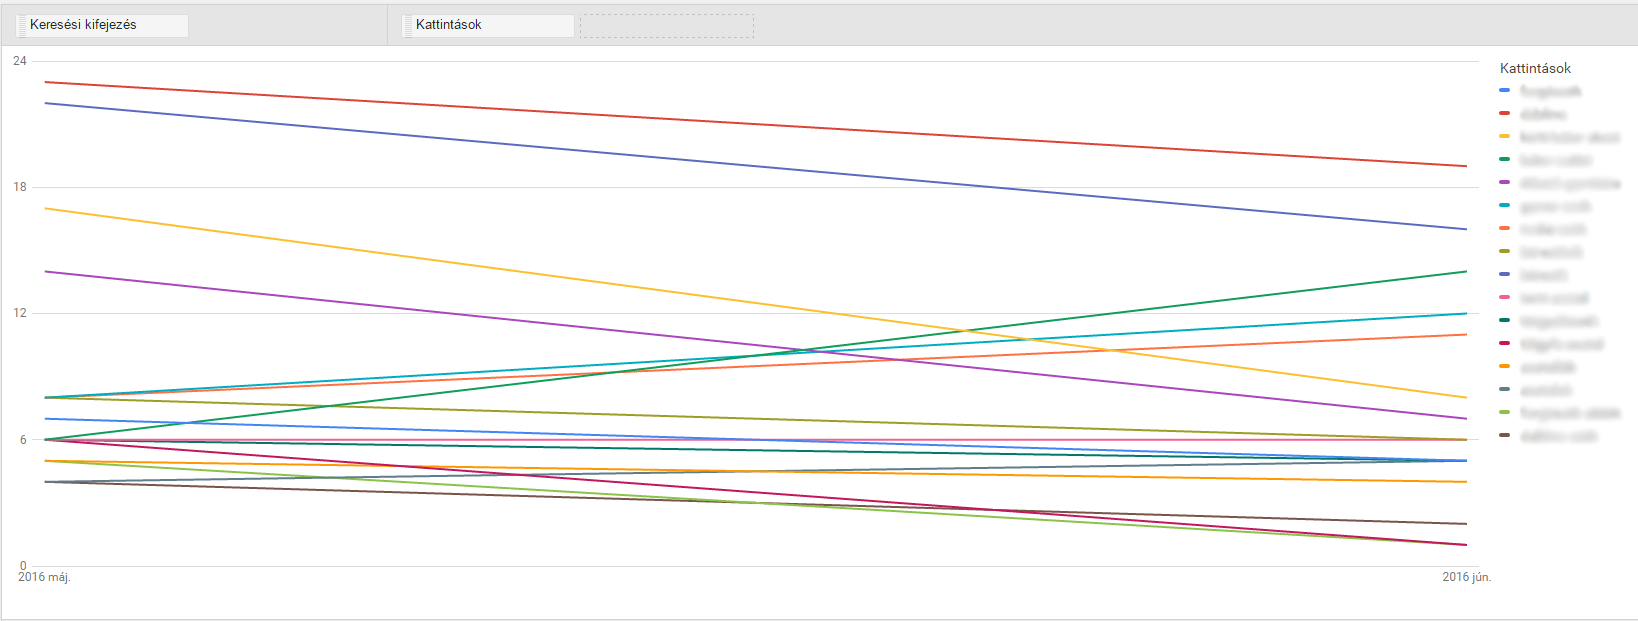
3. Search terms over time - by match
The search term analysis is suitable for general and term-matching keywords. We can identify which search terms are trending upwards. We can put poorly performing terms on a negative list or grab the rising keywords before the competition.
It is particularly effective in defining "customer service" keywords (words that users enter when there is a service outage).
4. Distribution of displays by instrument over time
If the ads appear in the top three positions, it is worth looking at the share of impressions by device. Google is constantly changing the ads in a given auction to ensure the best possible user experience.
As a result, the display rate can be volatile. With half of impressions now occurring on mobile devices, advertisers cannot afford to ignore display rates on any device.
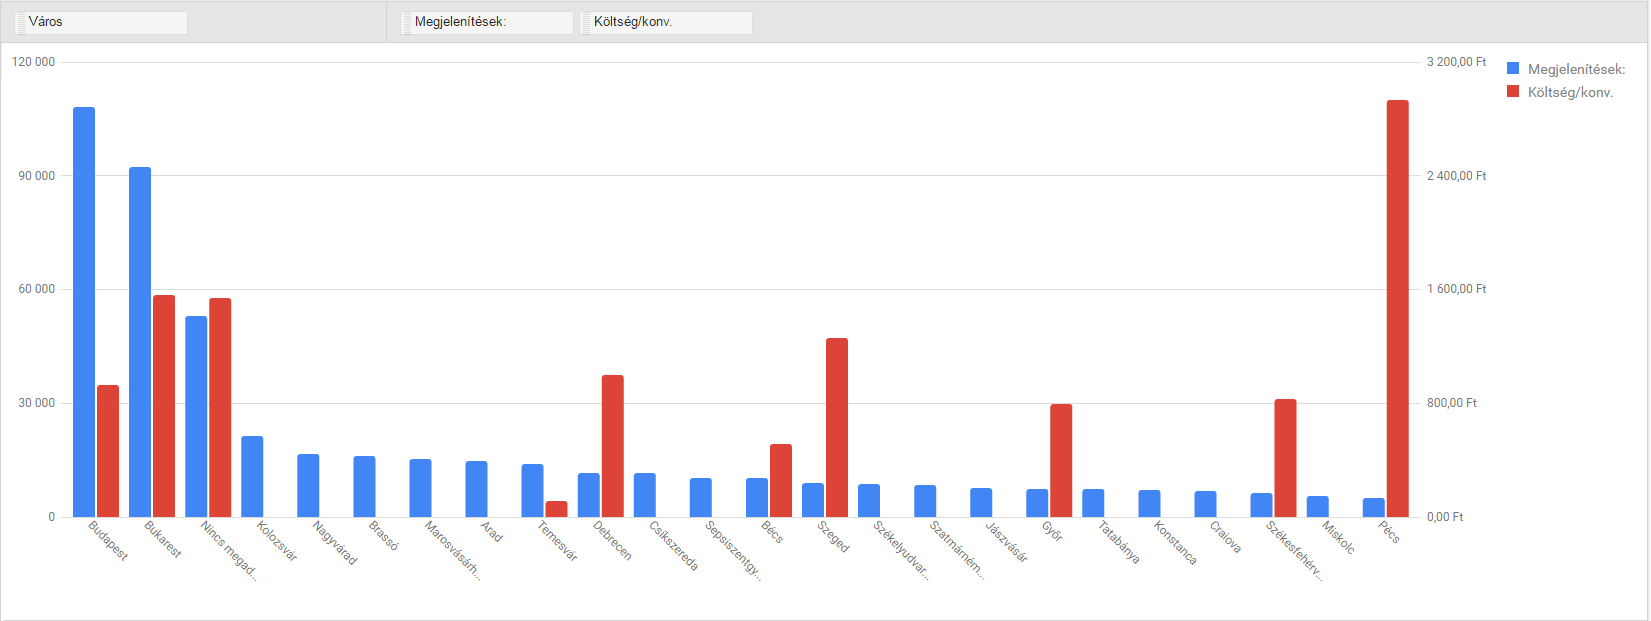
5. Cost and performance by area
Search volume, competition and user intent vary from area to area. Geographic segments allow us to understand how each region is performing. We can use these reports to define geographic bid modifiers.
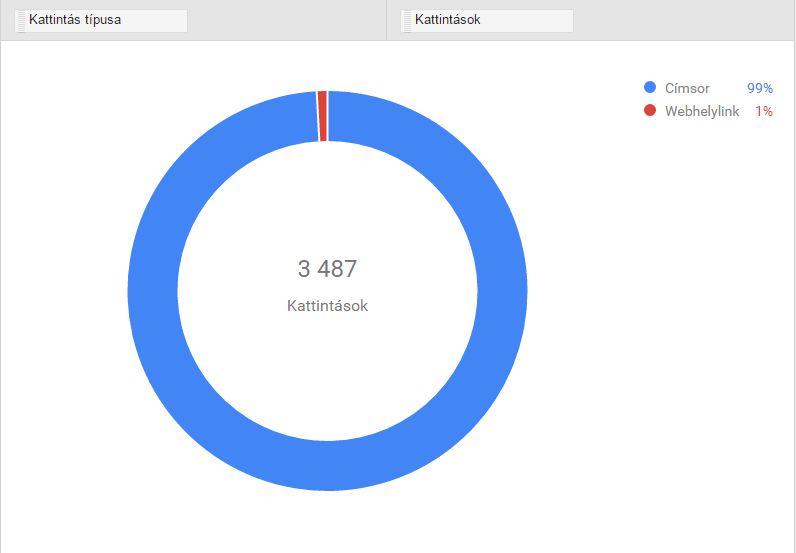
6. Breakdown by click type
What type of clicks do we get? If we use ad extensions, this report will show you. Remember that extensions should be checked regularly, just like ad variations.
7. Analytics indicators report
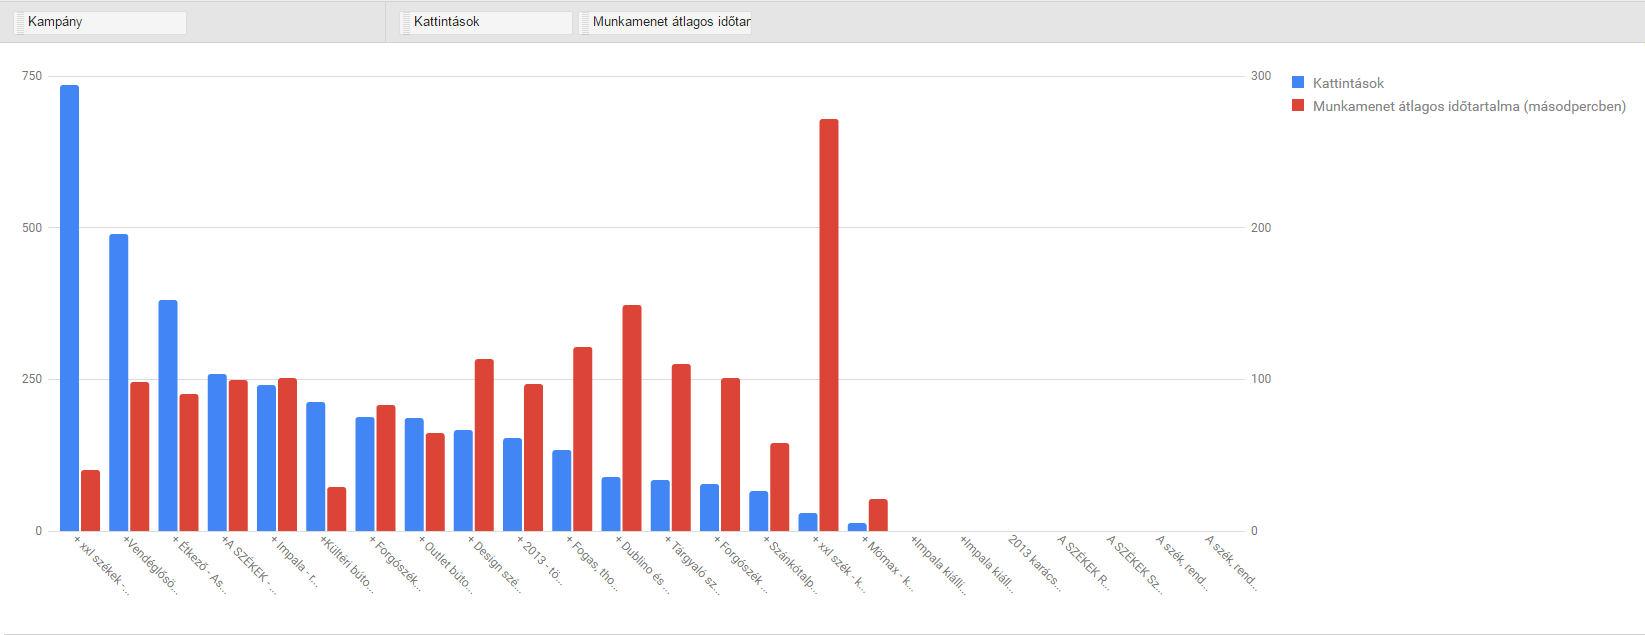
Google Analytics data is a good guide when Adwords conversions are not available. By comparing session duration and page/session count, we can learn more about specific intent.
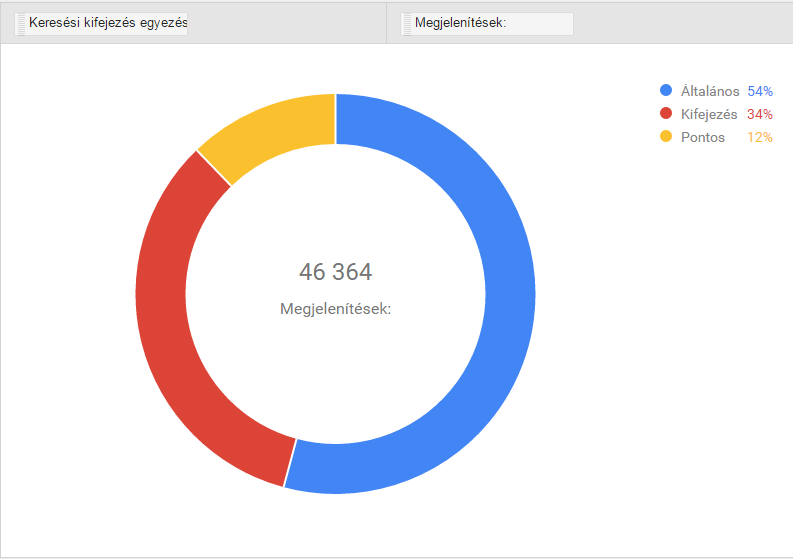
8. Displays by match type
Are the ads relevant enough for users? More impressions can be achieved with exact match keywords, and then relevance is higher when the search engine matches the right ad with the search intent.
If a high percentage of clicks come from general or phrase-matching keywords, you need to dig deeper.
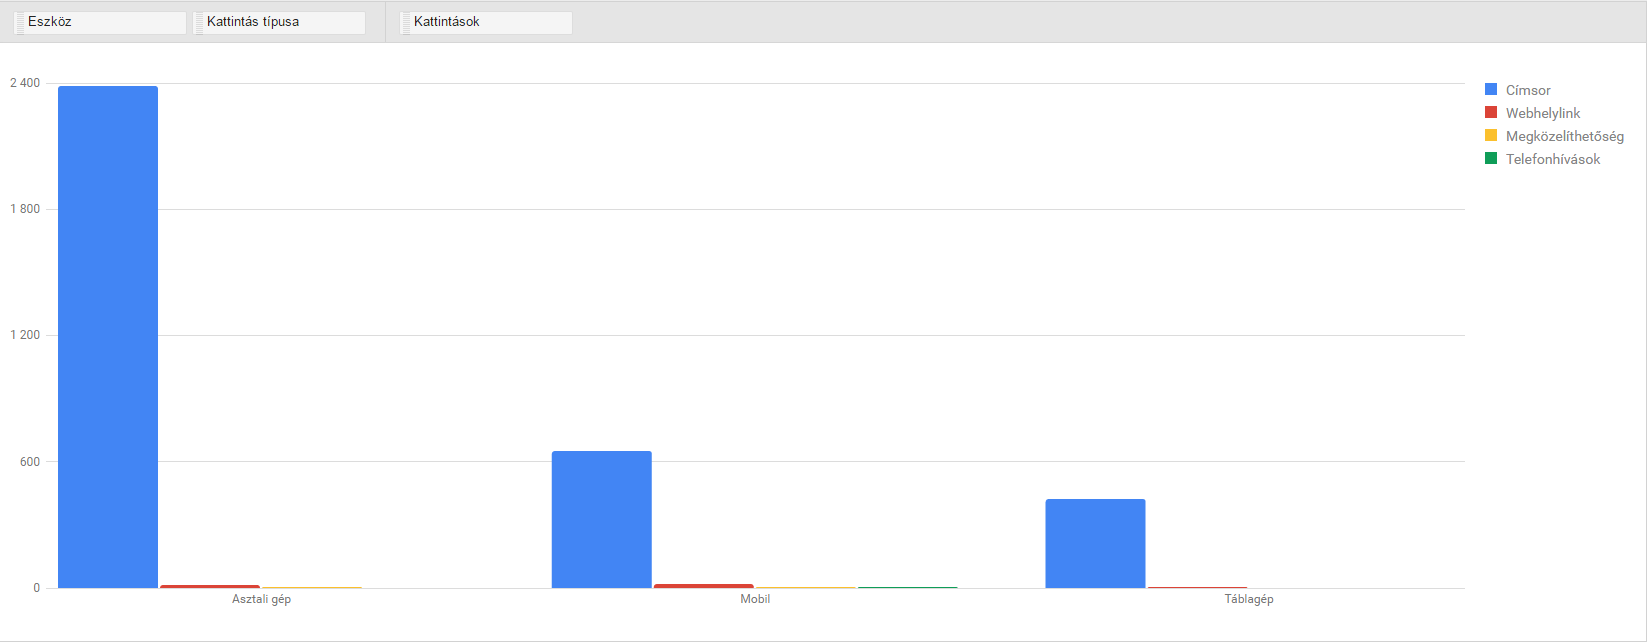
9. Click type by device
Mobile users want information as quickly as possible, and ad extensions are a useful tool to help them do this on the tiny screen. It is important to compare the type of clicks by device. If you don't see different types of clicks on mobile, check your ad extensions.
If you see that they have been approved by Adwords but are still underperforming, try creating a separate mobile internal link. This will separate mobile extensions, allowing you to target users specifically on the go and can also improve the relevance of your ads.
10. Performance by day of the week and hour of the day
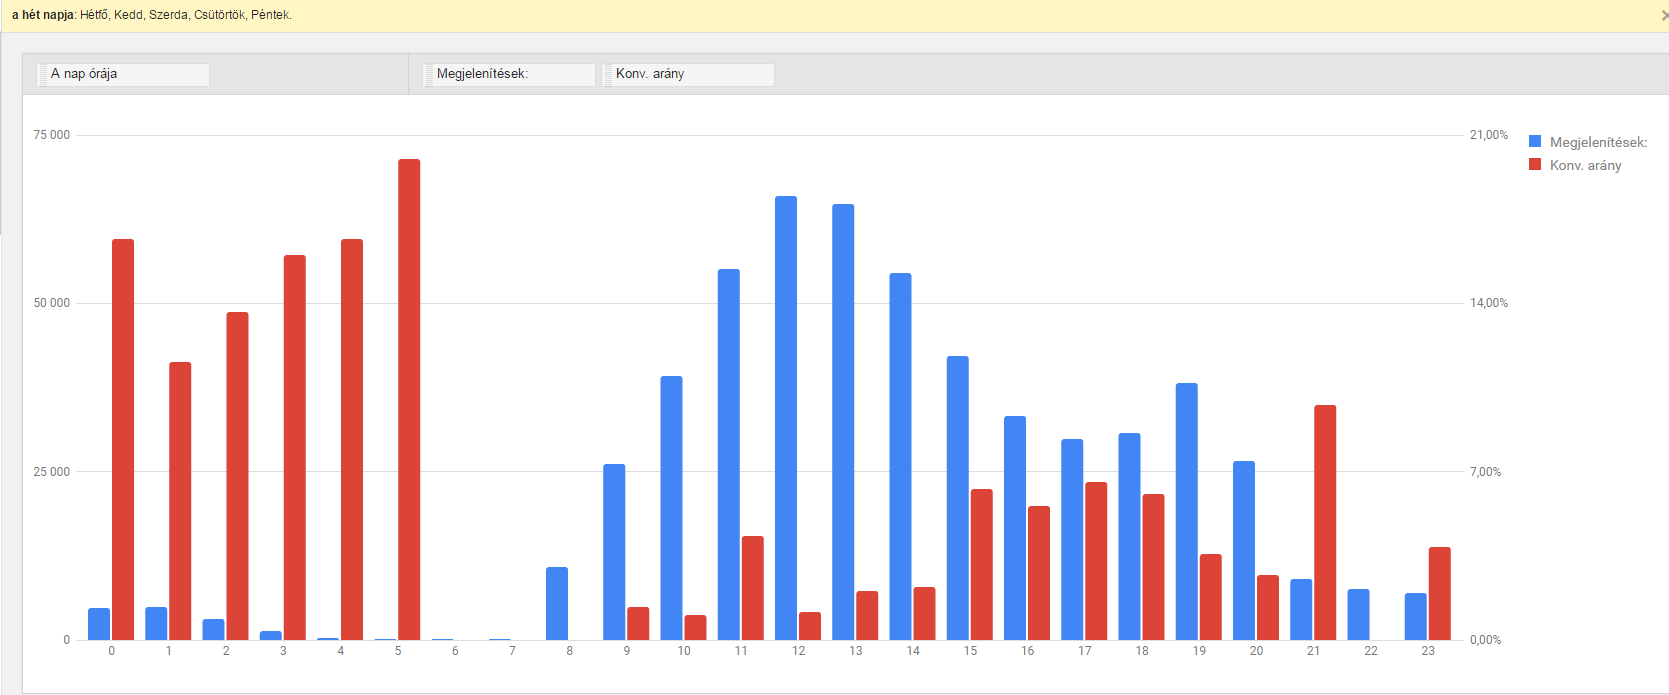
User intent and competition can be very variable throughout the week... CPC and position indicate the times at which competition fluctuates. Conversion rate and session duration indicate intent. Based on the results, we can adjust ad scheduling and bid adjustments throughout the week. The purchase intent is usually different at the weekend than during the week.
Summary
The Adwords Report Editor is one of the most useful improvements to the Adwords user interface in recent years. Its data visualization is an extremely effective way to identify opportunities in your account. And the metrics, dimensions and filters allow you to visualise data in multiple ways.
Source: ppchero.com
